Figure 10 - from "Allelopathically inhibitory effects of eucalyptus extracts on the growth of Microcystis aeruginosa"
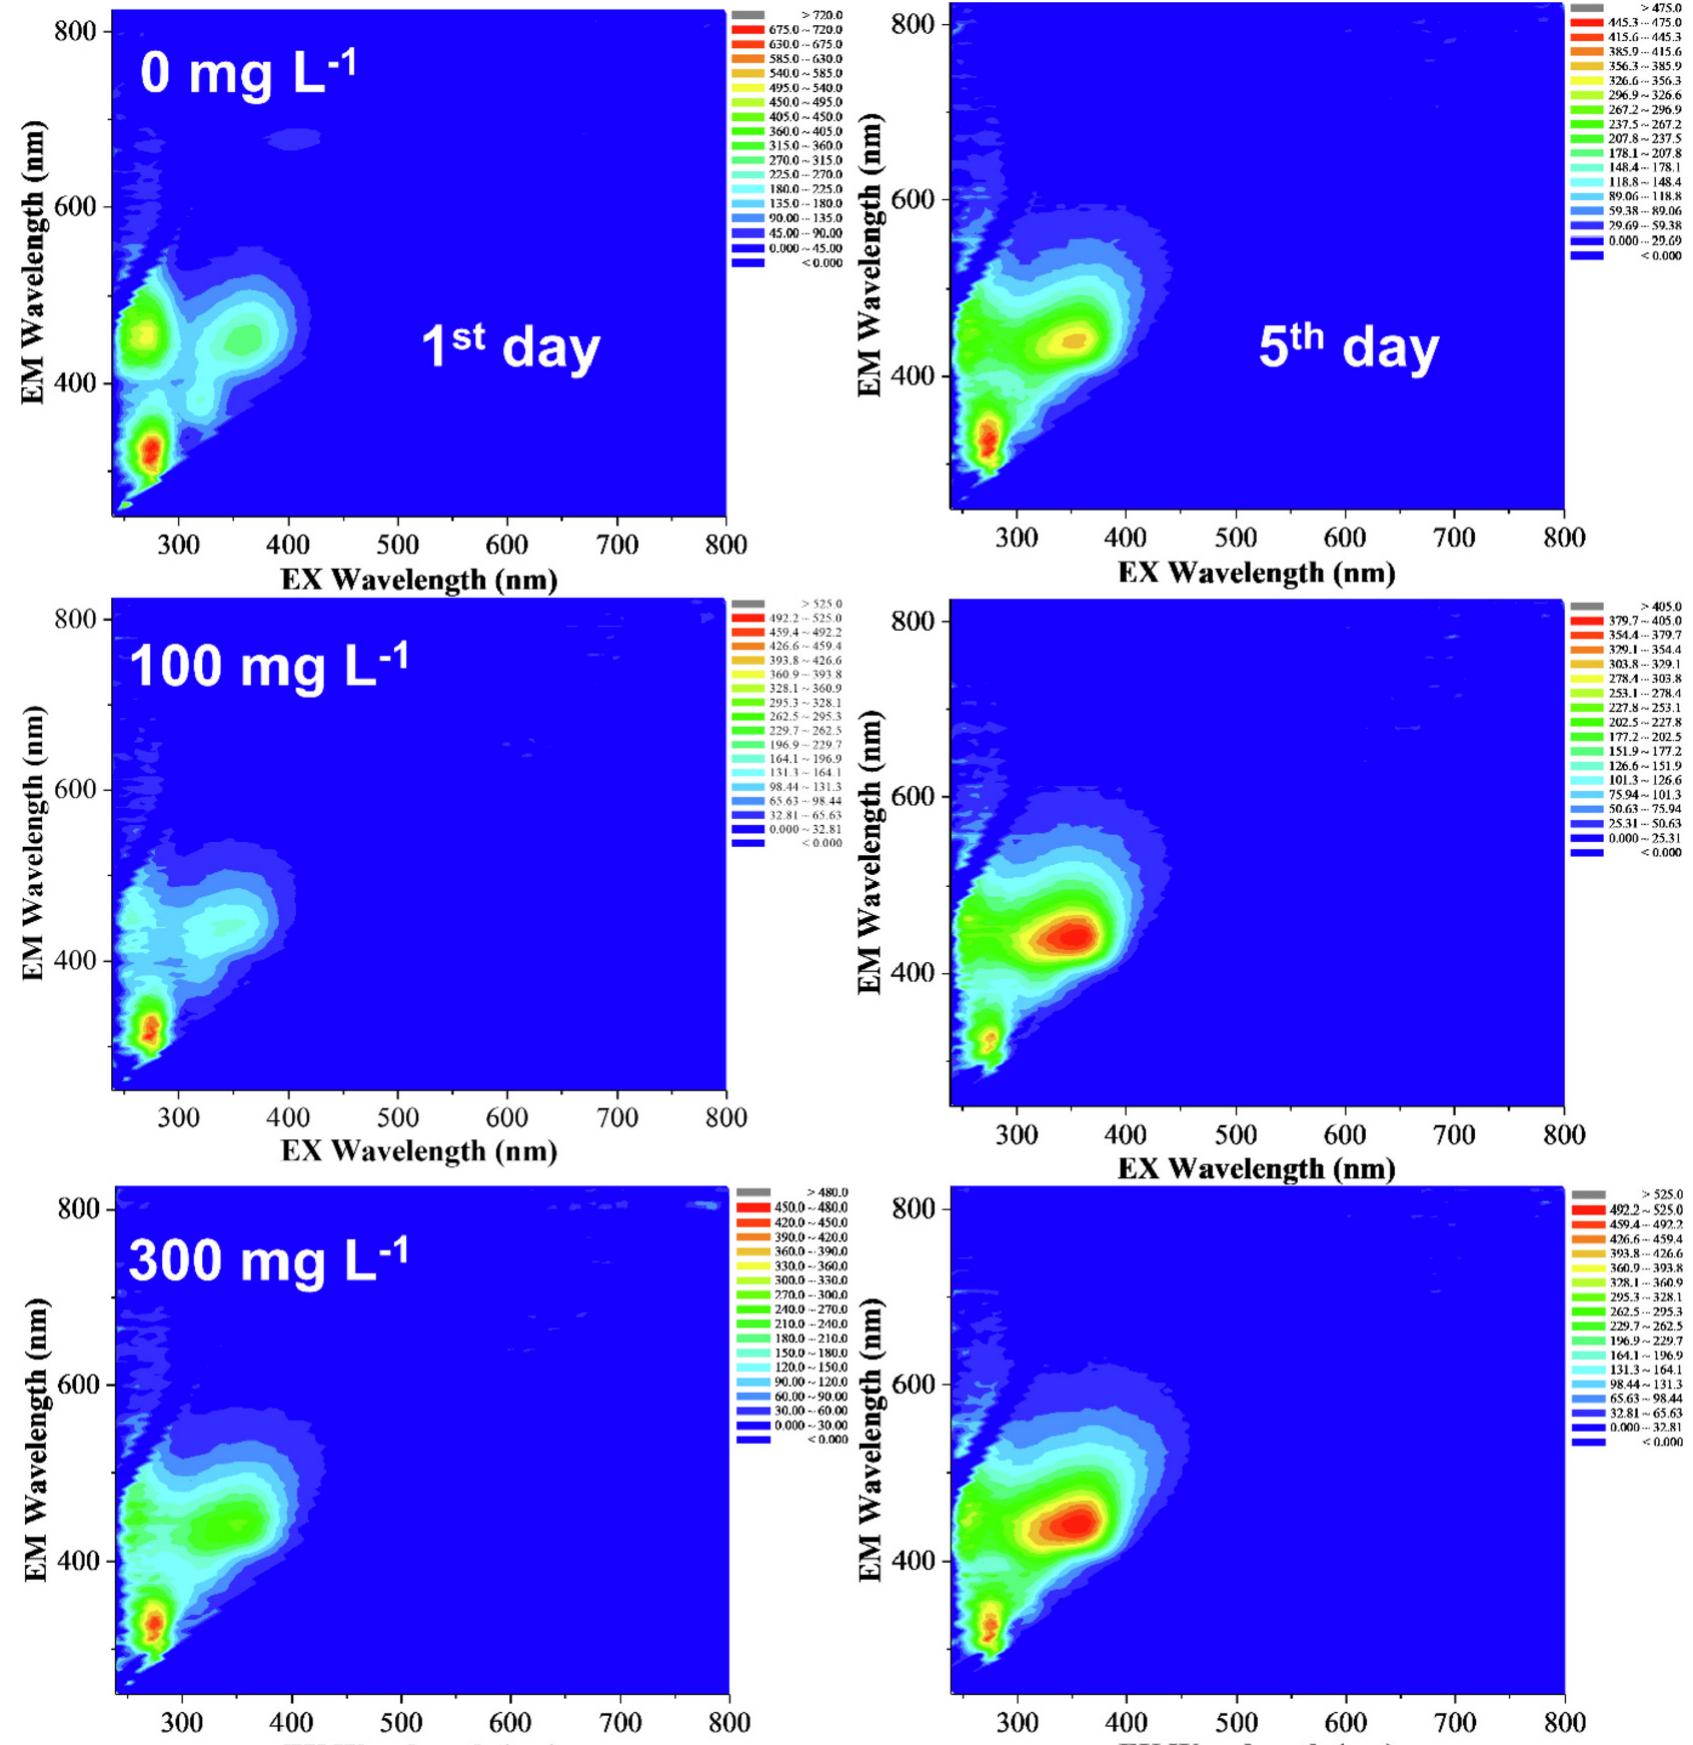
Fig. 8. Fluorescence EEM spectra for M. aeruginosa after 1 and 5 days of treatment by different ELE dosage. Three dimensional EEM fluorescence spectra of M. aeruginosa after 1 and 5 days of treatment by varying ELE dosage (0, 100, and 300 mgL~') are shown in Fig. 8. EEM fluorescence spectra of M. aeruginosa after 1 day of treatment mainly reflect the peaks On the other ELE, the EEM peaks located belonging to protein-like substances (e.g., trypto ocated near the excitation/emission wavelength o hand, it was found that after 5 days of treatment by fluorescence spectrum of M. aeruginosa appeared to be similar to the control and therefore exhibited pea protein-like substances. When ELE dosage was 100 the EEM fluorescence spectra of M. aeruginosa exhibited mainly the near the excitation/emission wave phan, tyrosine f 280/310 nm). ks attributed to or 300 mgL“!, ength of 350/ 450nm range, which may be associated with humic-like sub- stances. Based on these findings, one can deduce that the 100 and 300 mg L"! ELE dosage to the culture containing M. aeruginosa not
Figure source:
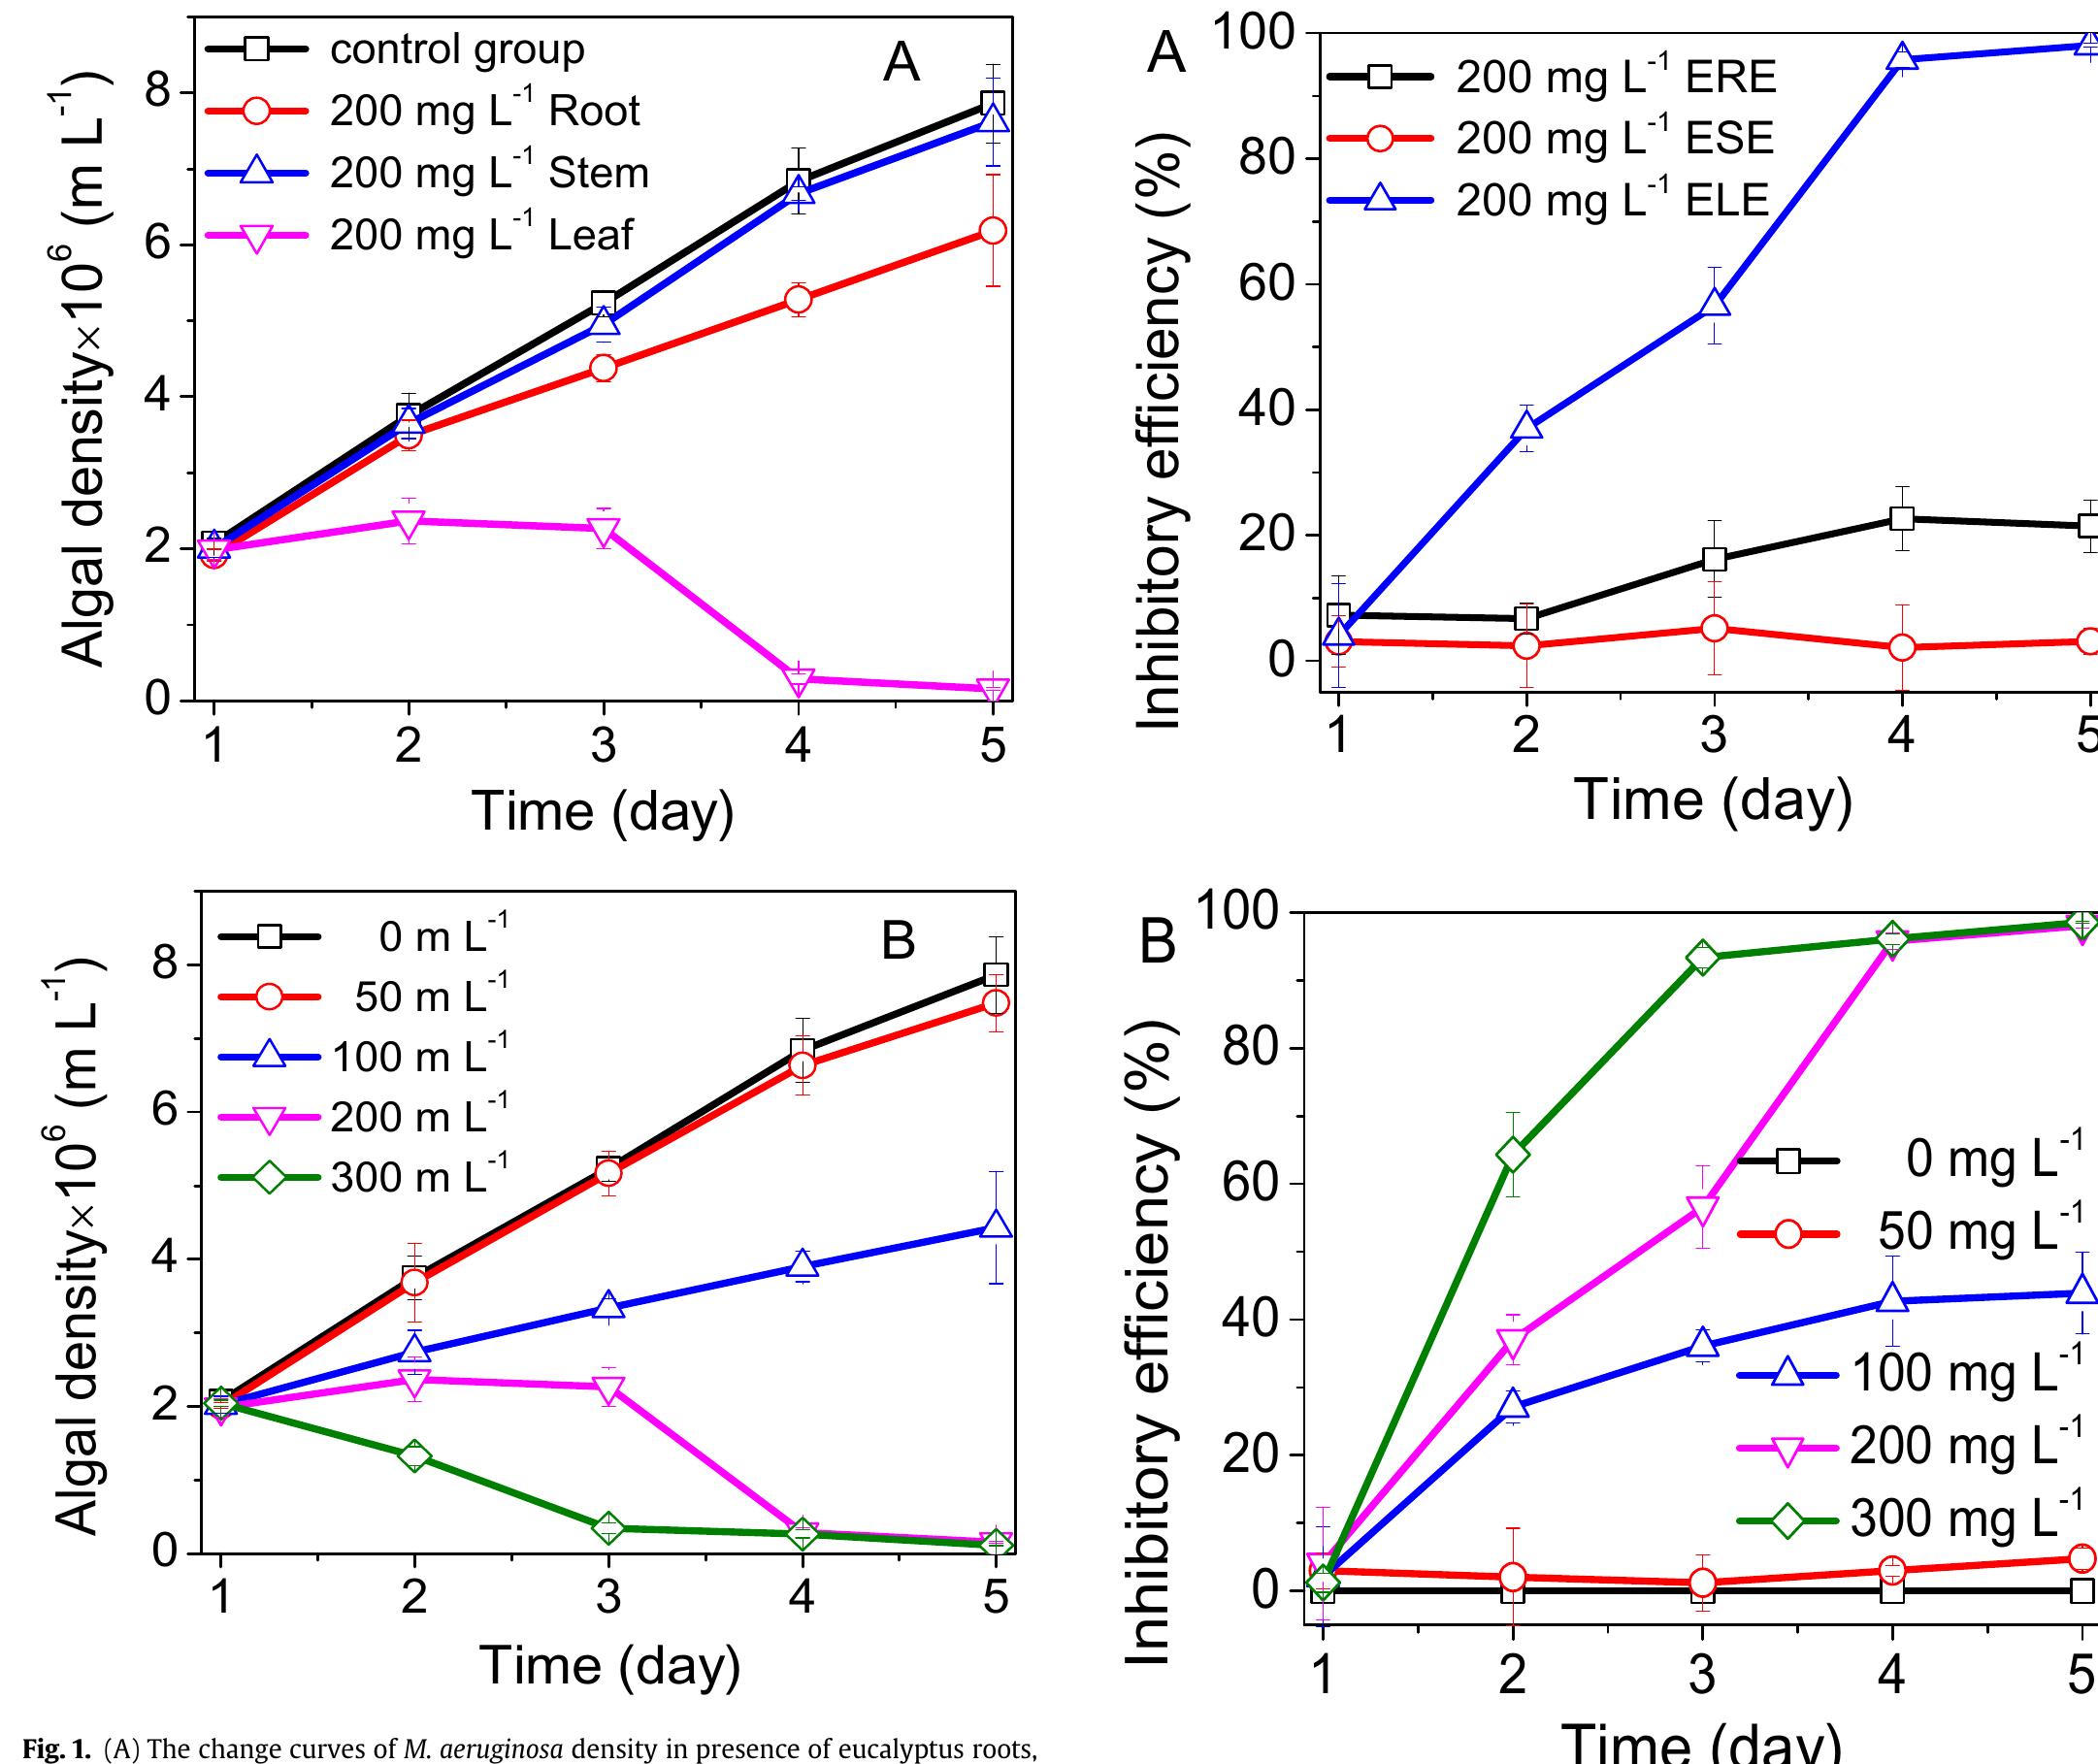
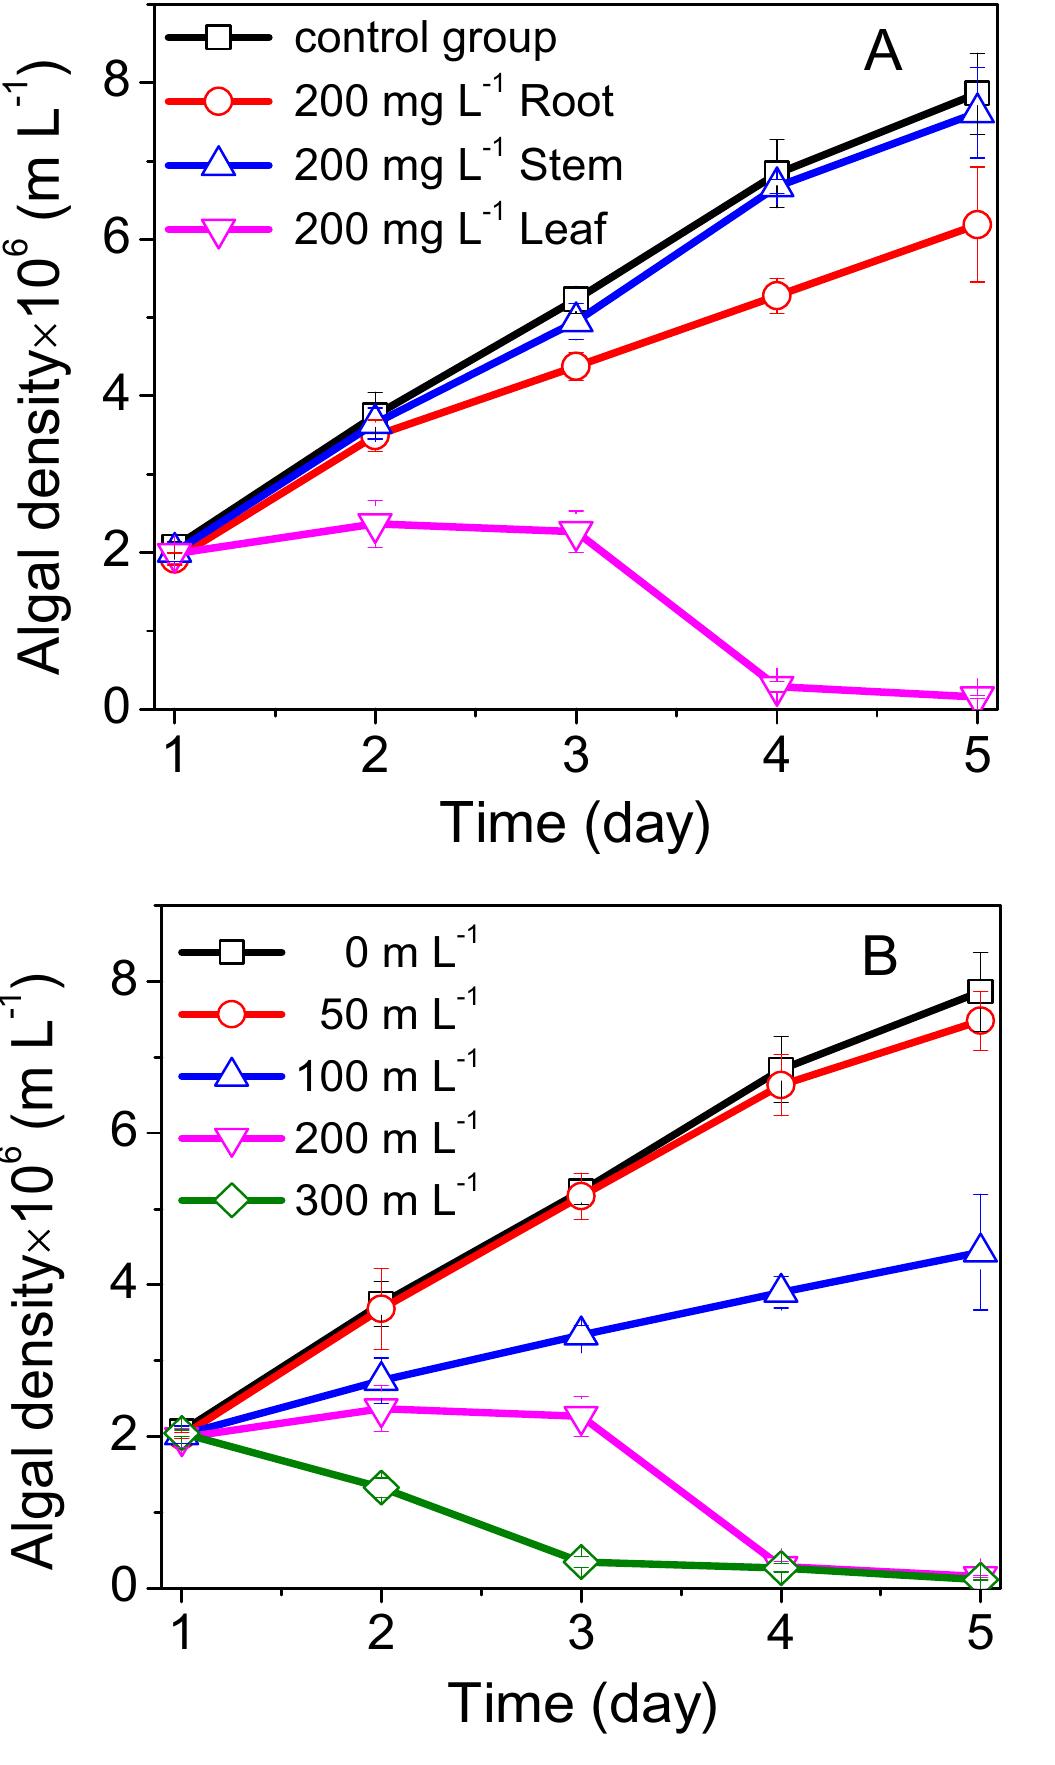
Abstract: Using eucalyptus extracts of roots, steams, and leaves as algicidal agents. Eucalyptus extracts of leaves showed the highest inhibitory performance in limiting the growth of Microcystis aeruginosa. Strong allelopathy of eucalyptus extracts of leaves is responsible for controlling Microcystis aeruginosa. Species abundance and diversity in the systems were unaffected by eucalyptus extracts of leaves.