VAEM is ideal for dissecting organellar identities and dynamics
Since the PM and intracellular compartments comprise a functionally interrelated network, we were keen to investigate the robustness for VAEM in tracking the dynamics of endomembrane components. In this regard, we studied auxin binding protein 1 (ABP1). Initially identified by its capacity to bind auxin and affect PM hyperpolarization, the functions of ABP1 are still under debate [34]. To obtain experimental cues for investigating the subcellular localization of ABP1, we generated an ABP1-YFP transgenic line under the control of its native promoter and examined the localization of ABP1 in the cotyledons under LSCM and VAEM, respectively. In accordance with previous reports, as visualized under LSCM, ABP1 was mainly localized to the PM and to highly dynamic intracellular structures (Fig. 1a). Unfortunately, it was not easy to discern under LSCM the intracellular structures that were labeled with fluorescence, but under VAEM it was reasonably clear that they were associated with the endoplasmic reticulum (ER) and some mobile intracellular compartments. As the expression level under the native promoter was low, the images obtained with wide-field epifluorescence could not clearly differentiate between areas with or without fluorescence (Fig. 1b). In contrast, we were gratified to discover that the intracellular compartments defined by ABP1-YFP fluorescence were well correlated with the mCherry-HDEL tagged ER in the time-series, they were partly co-localized with Golgi apparatuses (N-acetyl glucosaminyl (NAG) transferase–mCherry), but not with mitochondria markers (mCherry-ssβATPase) (Fig. 1c-d). Notably, some bright punctate structures, possibly vesicles or other endosomal structures, could be observed adjacent to the ER or transported along the extended ER tubules (Fig. 1d), further implying substantial roles for these ABP1-labelled structures in ER-endosome association. It was also found that the punctate structures co-diffused with Golgi apparatuses in the time series (Fig. 1e), further suggesting the involvement of ABP1 in endosomal trafficking and endocytic/exocytic activities. As shown in Fig. 1, under VAEM the low background fluorescence allowed us to follow easily at high temporal resolution (200 ms) the ER dynamics in cotyledon epidermal cells as characterized using fluorescence proteins, which was not possible using conventional LSCM. Similarly, other functionally correlated organelles displaying high mobility, namely Golgi apparatuses and mitochondria, were also visualized with NAG transferase-GFP and mCherry-ssβATPase transgenic lines (Additional file 2: Figure S1, Additional files 3 and 4) [35, 36].

Dual-color VAEM fluorescence co-localization with organelle markers is ideal for dissecting protein localization and dynamics in the cell cortex, taking Auxin Binding Protein 1 (ABP1) as an example. The punctate structures in VAEM images were tracked by using spatially and temporally global particle assignment with MATLAB. The incident angles were between 63.03° and 66.64° for HDEL-GFP seedlings, corresponding to penetration depths at 120 nm (66.64°) – 250-300 nm (63.03°) respectively, depending on the practical conditions for the adherence of seedling. a Transgenic Arabidopsis line expressing ABP1:ABP1-YFP (ABP1:ABP1-YFP / Col-0) showing subcellular localization to plasma membrane and intracellular structures, circles indicates punctate structures tagged by YFP fluorescence; b Transgenic Arabidopsis line expressing ABP1:ABP1-YFP showing blurred fluorescence, corresponding bright field images were shown in the inlets; c Transgenic Arabidopsis line expressing ABP1:ABP1-YFP showing uniformed distribution to ER and punctate structures under VAEM; d The punctate structures partly co-localize to Golgi apparatuses but do not co-localize to mitochondria; e Some ABP1-YFP tagged punctate structures frequently co-diffuse with Golgi apparatuses. The time series are shown for every 4 images. Bars = 200 μm (a), 7 μm (b-d), 5 μm (e). Interval between frames = 200 ms
In addition to the imaging in cotyledon epidermal cells, VAEM is also applicable to epidermal cells of other tissues. We further used the transgenic HDEL-GFP line to follow ER dynamics in hypocotyl epidermal cells, root epidermal cells, young rosette leaves and stomata respectively, further demonstrating the wide applicability of VAEM in plant cell researches. Similarly, hypocotyl epidermal cells were readily imaged due to their relatively big size and planar shape (Additional file 2: Figure S2). It can be found the ER tubules were distributed in a lower density in root. However, as part of the tubules were not in the imaging plane, the variable and non-planar shape of leaf pavement cells only allow us to observe ER dynamics in limited areas closely adhering to the slide in these cells (Additional file 2: Figure S1 and Additional file 5). As cell wall and specimens of larger sizes may inevitably pose a physical barrier in observations on plant cells, freshly detached tissues are always preferred to obtain better efficacy in adhering the specimen closely to the slide, which is particularly applicable to observations in cotyledon and young leaves.
Endocytic events and intracellular trafficking can be followed under VAEM
Given that, as the smallest units, endocytic vesicles play pivotal roles in connecting different endosomal components, the role of clathrin in internalizing extracellular substances has been well investigated, as it is assembled at the PM and initiates endocytic events [37]. In the present study, the TIRF system was equipped with a micrometer allowing continuous lateral adjustment of the spatial filter assembly, such that the position of the beam at the back aperture of the objective could be modulated to switch between TIRF and epifluorescence modes. Under epifluorescence illumination, only blurred fluorescence was found to be associated with the PM, whereas, under VAEM, clathrin light chain (CLC)-GFP formed discrete foci at the PM or were organized into small clusters, contributing to the formation of an endocytic complex at the site (Fig. 2a and Additional file 2: Figure S3). The CLC-GFP foci at the PM could be easily distinguished, though CLC-GFP may also label some brighter, out-of-focus intracellular structures, corresponding to different incident angles and penetration depths [ranging from approximately 100 nm (67.73°) and 130 nm (65.69°)] (Additional file 2: Figure S3 and Additional file 1, indicated with arrowhead), possibly Golgi apparatuses or trans-Golgi network (TGN). When the incident angle of the laser was decreased from subcritical angles towards zero degrees, the foci were lost in the background signal arising from organelle-localized CLC-GFP and cytoplasmic CLC-GFP signals. Similarly, AtFLOTTILIN1a (FLOT1a) is identified as another candidate involved in endocytic activities independent of the clathrin-mediated pathway [14]. As it has been reported previously to be a potential raft-located protein [14], the dynamics of FLOT1a were also examined under VAEM. As expected, mCherry-FLOT1a was found to be prominently associated with the PM and was organized into punctate structures. The FLOT1a-positive punctate structures were dynamic in the vicinity of the PM, but in contrast to those observed in the CLC-GFP lines, some of the puncta were laterally mobile (Fig. 2c and Additional file 6), possibly as individual structures budding off from the PM and entering the cytoplasm. In the presence of BFA, a specific pharmacological agent capable of inhibiting COPI vesicle formation at the Golgi apparatus [38], CLC-GFP and mCherry-FLOT1a were largely colocalized to the BFA-induced compartments during their formation, whereas there were still some apparently associated green and red puncta in the cytosol (Fig. 2d).
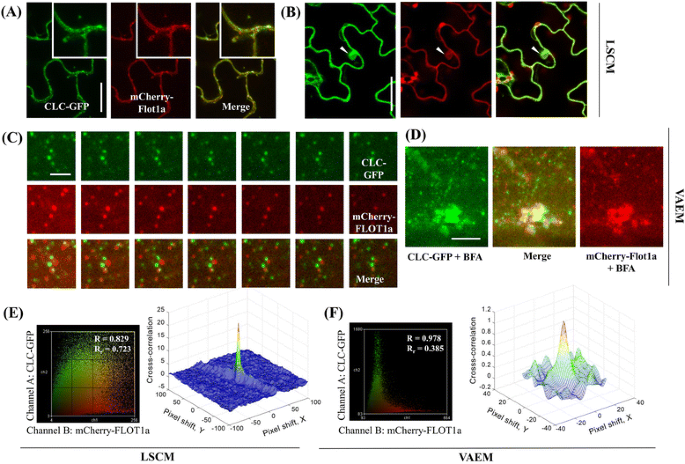
VAEM allows for reliable co-localization analysis on protein candidates at single particle level. a Clathrin light chain (CLC) -GFP and mCherry-FLOT1a both localized to PM and intracellular punctate structures under LSCM; The close-up inlets showed that CLC-GFP and mCherry-FLOT1a colocalized at PM and intracellular structures; b BFA treatment induced both CLC-GFP and mCherry-FLOT1a to accumulate into BFA compartments, indicating both clathrin and FLOT1a were involved into active endocytic events; c Transgenic Arabidopsis line co-expressing CLC-GFP and mCherry-FLOT1a showing characteristic localization to largely separated punctate structures; d VAEM observations on BFA-induced compartment formation. e Co-localization analysis using ImageJ intensity correlation analysis plugin and Protein Proximity Index (PPI) analysis on the LSCM images (a) indicated clathrin and FLOT1a were co-localized in a high percentage; f Co-localization analysis using ImageJ intensity correlation analysis plugin and PPI analysis on the VAEM images (c) indicated clathrin and FLOT1a were associated rather than co-localized. Bars = 20 μm (a-b), 3 μm (c-d); Interval between frames = 200 ms
As both CLC-GFP and mCherry-FLOT1a are sensitive to brefeldin A (BFA) treatments (Fig. 2a-b), we were curious to examine whether CLC-coated vesicles and FLOT1a-tagged vesicles were colocalized following internalization. Therefore, fluorescence-based co-localization analysis was employed to study the functional correlation of both proteins in terms of their specific cellular location. We co-expressed CLC-GFP and mCherry-FLOT1a and then analyzed their spatial correlation using LSCM images and VAEM time-series images, respectively. Both FLOT1a and CLC have been reported previously as membrane associated proteins and, as shown in Fig. 2a, both CLC-GFP and mCherry-FLOT1a were found to be localized to the PM and to some intracellular structures. Further close-up LSCM observations indicated that CLC-GFP and mCherry-FLOT1a puncta were co-localized or closely associated with each other, correlating well with the high overlap coefficient, Rr = 0.723, as shown in the scatter plots (Fig. 2a and e). In contrast to the LSCM findings, however, the VAEM time series showed that in fact most of the CLC-GFP and mCherry-FLOT1a puncta were not co-localized (Fig. 2c). As a result, the overlap coefficient Rr was 0.385 from the calculation using the time-series images (Fig. 2f, ten sequential frames in the present study), indicating a low percentage of co-localization of these two protein candidates and further suggesting that VAEM time-series can provide a more reliable co-localization analysis of intracellular structures. As a quantitative measure of colocalization emphasizing that colocalization occurs at the length scale of the resolution of the microscope [33], Protein Proximity Index (PPI) was also calculated for comparison, as shown in the 3D cross-correlation plots (Fig. 2e and f), [PPI = 0.25 ± 0.05 (GFP channel) and 0.41 ± 0.06 (mCherry channel) for VAEM, where PPI = 0.53 ± 0.17 (GFP channel) and 0.72 ± 0.22 (mCherry channel) for LSCM]. Moreover, transgenic Arabidopsis lines co-expressing CLC-GFP / mCherry-FLOT1a, GFP-FLOT1a / mCherry-FLOT1a and CLC-GFP / dynamin related protein 1C (DRP1C)-mOrange generated by crossing, were each subjected to VAEM observations followed by single-particle tracking (SPT) and calculations were made of the distances between captured dual-color labeled punctate structures (Fig. 3a). In the control (GFP-FLOT1a and mCherry-FLOT1a), about 50% of the GFP signal was classified as co-localized and more than 40% was classified as associated. Among the protein candidates examined, CLC were found to be either co-localized (about 30%) or associated (50%) closely with DRP1C, which was consistent with their synergistic actions in vesicle formation and internalization; furthermore, about 80% of the CLC-positive puncta were classified as associated with mCherry-FLOT1a, whereas only 8% or 12% of the GFP signals, respectively, was co-localized to or independent to mCherry-FLOT1a puncta, further confirming the applicability of VAEM-based SPT for the co-localization analysis of putatively correlated proteins (Fig. 3b-c).

Co-localization analysis on proteins of interest using VAEM-based single particle tracking. a Transgenic Arabidopsis line co-expressing CLC-GFP / DRP1C-mOrange, GFP-FLOT1a / mCherry-FLOT1a and CLC-GFP / mCherry-FLOT1a were subjected to VAEM followed by single particle tracking and calculation on the distance between the captured punctate structures labelled by dual colors. b We classified the resulting distances into three categories: (i) colocalized: a distance between two centers that was below the resolution limit of the objective lens (0.24 μm in this study); (ii) associated: a distance less than the sum of the radii of two punctate structures (< 0.96 μm in this study); and (iii) independent: a distance larger than the sum of the radii of two punctate structures (> 0.96 μm). D stood for the distance between the centers of two adjacent puncta for analysis. c Percentages of co-localized, associated and independent puncta for the protein candidates
VAEM observations on coordinate behaviors in cytoskeletal dynamics
Luckily, VAEM imaging using subcritical angles also allowed the tracking of cortical actin filaments (AFs) labelled with the GFP-tagged F-Actin Binding Domain of Fimbrin2 (GFP-fABD2) (Fig. 4, Additional file 2: Figure S4, and Additional file 7). As shown in Additional file 2: Figure S4, extensive arrays of longitudinal actin bundles and a dynamic network of AFs could be observed in elongated epidermal cells of the hypocotyls. Several filaments rapidly became bundled into single filaments, but also individual filaments participated in the creation of multiple bundles, all utilizing the same zipper-like motion (indicated by arrows). To follow the dynamics of microtubules (MTs) in epidermal cells, epidermal hypocotyl cells of plants expressing mCherry-α-tubulin 5 isoform (TUA5) were also imaged. The MTs were clearly visible at subcritical angles, showing all the typical configurations previously described for wild-type seedlings: basket, longitudinal, oblique and transverse array (Additional file 2: Figure S5). In time-lapse images of mCherry-TUA5-expressing cells (Additional file 8), though microtubule growth was apparent, microtubules did not show obvious assembly and disassembly events at a temporal resolution of 200 ms.
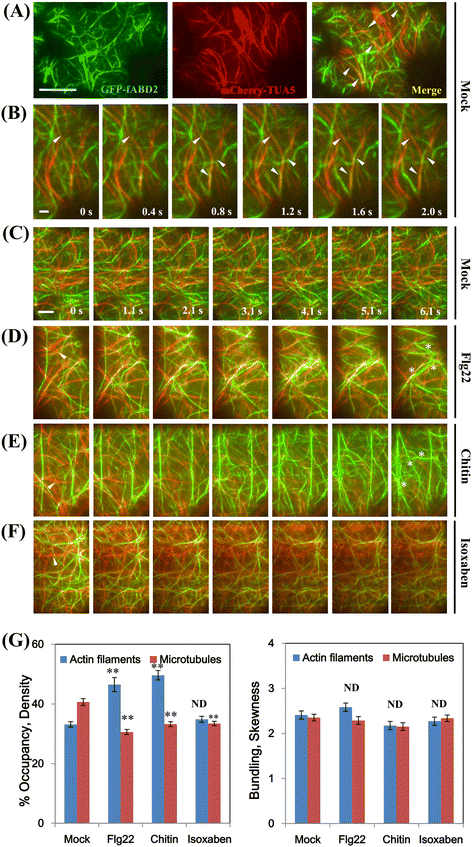
PAMP significantly altered cytoskeletal architecture and dynamics as revealed by dual-color VAEM. To investigate whether the two cytoskeletal structures interact coordinately, seedlings expressing green fluorescent protein (GFP)-F-actin binding domain of fimbrin2 (fABD2) and mCherry-α-tubulin 5 isoform (TUA5) were generated by crossing. LSCM and VAEM were carried out on the seedlings respectively. a AFs and MTs in mock-treated epidermal cells from the wild-type cells, arrows indicate actin fragments reside in transient coincidence with MTs; b Selected frames from a time series of a GFP-fABD2 and mCherry-TUA5 dual-labeled line; c AFs and MTs in the wild-type epidermal cells. d to e AFs appeared to be more abundant after flg22 and chitin treatment, while the transverse MT organization gradually changed to longitudinal fragments. Epidermal cells treated with 1 μM flg22 or 10 μM chitin had a significant increase in AF abundance compared with mock-treated seedlings. f To address the specificity for the elicitor-triggered reorganization of cytoskeletal components as above, 50 μM isoxaben, a cellulose synthesis inhibitor, was applied to treat the seedlings. The MTs were dramatically disordered following incubation while AFs did not show significant changes in density and intensity. g Average filament density (percentage of occupancy) analysis was performed on images collected from epidermal cells in the cotyledons. When compared with mock-treated cells, the AF density was significantly increased after 1 μM flg22 and 10 μM chitin treatments; in contrast, MT density decreased significantly after chitin and flg22 treatment, while isoxaben treatment significantly decrease MT density without affecting AF density; The extent of filament bundling, or skewness, was measured. No significant differences were observed among treatments. Values given were mean ± SE. (n = 100 cells from 10 cotyledons per treatment; ** P < 0.001; ND, no significant difference; Student’s t-test). Bars = 10 μm. Interval between frames = 200 ms, “0 s” referred to the time point at 5 min after corresponding treatment
Simultaneous tracking of both types of cytoskeletal components using stably transformed lines with dual-color reporters may provide a powerful tool for revealing coordinate behaviors and elucidating underlying mechanisms. VAEM observations on the dual-labeled epidermal cells demonstrated that cortical AFs and MTs were coaligned at numerous sites (Fig. 4a-b), which were mainly found between transversely or obliquely oriented AFs and MTs at the cell cortex. Straightening and bending events of cortical AFs, as reported previously [39], were also occasionally observed to occur within a couple of seconds at coalignment sites (Fig. 4b). Several studies have shown that perturbations of one cytoskeletal component by extracellular stimuli can change the organization of the other [18]. Here, we observed that the transverse MT organization gradually changed to a disordered configuration upon Pathogen-Associated Molecular Pattern (PAMP) (flg22 and chitin) exposure and resulted in a reduction of co-alignment between AFs and MTs (Fig. 4d-e). To quantify cytoskeletal remodeling in cotyledons, the cortical actin architecture was measured for density and skewness, which are metrics used for cytoskeletal component to estimate the percentage of occupancy and the extent of bundling, respectively [26, 40]. As shown in Fig. 4d-e and g, AF density in the cortical array was significantly increased after 5-min treatment with 1 μM flg22 or 10 μM chitin (P < 0.001), which was consistent with previous results for dark-grown hypocotyl cells [40]. However, MTs showed a significant decrease in density in the focus plane (P < 0.001), further suggesting that the MTs may also play a specific role in the perception of pathogenic microbes. Collectively, these data demonstrate that the cortical actin array in cotyledon epidermal cells responds within minutes to several diverse PAMPs, leading to significant increases in AF density. To examine the response specificity for the elicitor-triggered reorganization of cytoskeletal components as above, isoxaben, a cellulose synthesis inhibitor, was applied to the seedlings. As expected, following incubation the MTs were dramatically disordered and were changed into almost longitudinal fragments, further confirming the microtubule / microfibril paradigm; in contrast, actin filaments did not show significant changes in intensity and density (P > 0.05) (Fig. 4f-g). These results address the specificity of the coordinated behavior of AFs and MTs in response to PAMP elicitation, though the underlying mechanisms need further investigations.
Comparative analysis of membrane compartmentalization by using LSCM and VAEM
As with yeast and animal cells, plant cells similarly have a sub-compartmentalized PM, in which membrane microdomains have been demonstrated to modulate endocytic events and signaling initiation [24, 41]. As shown in Fig. 5, transgenic Arabidopsis seedlings expressing several previously identified microdomain-located proteins (StREM1.3, AtREM1.2 and AtFLOT1a) were generated and examined under LSCM and VAEM, respectively. Two well-characterized glycosyl phosphatidylinositol (GPI)-anchored proteins, SKU5 and COBRA, were also selected, as it has been extensively reported in animal and in yeast cells that GPI proteins are predominantly located in membrane rafts [20, 42]. To obtain a detailed view of the membrane domains, LSCM was used to image the upper surface plane of cotyledon epidermal cells of 3- to 4-day-old plants. A diffuse but uniformly distributed fluorescence labeling of the PM was observed for the two previously identified remorins (REMs) and for the GPI-anchored proteins, however, microdomains showing significantly increased fluorescence intensity were not detected (Fig. 5b-f), while AtFLOT1a-GFP displayed an uneven localization on the cell surface (Fig. 5a).
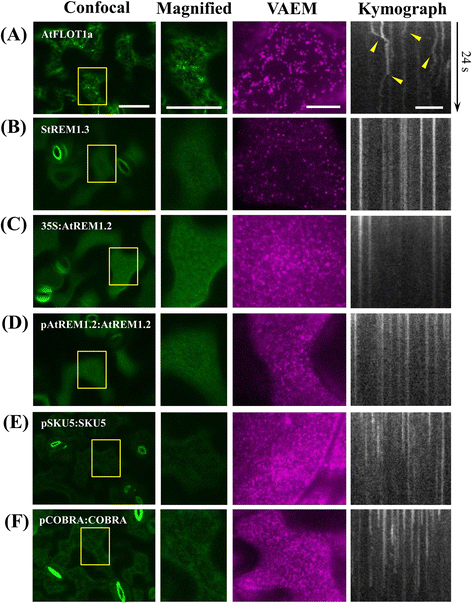
Comparative analysis on the PM subcompartmentation using LSCM and VAEM. To obtain a detailed view of the membrane domains, LSCM was firstly used to image the upper surface plane for cotyledon epidermal cells; VAEM and kymograph analysis were utilized to capture protein dynamics on the PM. a AtFlot1a displayed obviously uneven localization under LSCM and high lateral motility under VAEM, arrows indicate deviations in kymograph curves; (b-d) 35S:StREM, 35S:AtREM1.2, pREM1.2:AtREM1.2 showed diffused but uniformly distributed fluorescence labeling of the PM, while they formed puncta showing low lateral motility under VAEM; (e-f) pSKU5:SKU5-GFP and pCOBRA:COBRA-GFP demonstrated similar distribution patterns to those of REMs, but displayed relatively higher lateral motility. Bars = 50 μm (LSCM), 10 μm (VAEM); Interval between frames = 200 ms
By contrast, as VAEM allows observations at high signal-to-noise ratio (SNR) for cellular events occurring in the vicinity of the PM, both AtREM1.2 and StREM1.3 segregated into distinct microdomains showing relatively low motility in the time-lapse images as expected (Fig. 5b-d). Notably, GFP-AtREM1.2 as expressed under the control of the endogenous promoters formed static punctate structures as seen under VAEM (Fig. 5c-d), which were not significantly different from that expressed under the control of 35S promoter, indicating that AtREM1.2 overexpression did not significantly change the expression pattern or the signal intensity in the membrane microdomains. To assess the temporal stability of these microdomains, time-lapse recording and kymograph analysis were performed on the time-series images. As expected, both SKU5 and COBRA displayed similar patterns in fluorescence distribution and punctate motility in comparison to REMs, since the results clearly showed that, for most of the punctate structures, REMs, SKU5, and COBRA all exhibited undetectable lateral stability (Fig. 5e-f). Interestingly, another previously identified microdomain-located protein, AtFLOT1a-GFP, displayed high motility and showed variability in punctate sizes, which may correspond to endocytic vesicles or different oligomerization statuses as previously reported for their homologs in mammalian cells (Fig. 5a) [14]. It did not localize to relatively stable microdomains in the PM, unlike StREM1.3 and AtREM1.2 as described above, further implying the heterogeneity of distinct microdomains and the biological complexity of membrane compartmentalization in vivo.
Kinetic properties of membrane proteins as resolved by VAEM and single-particle tracking
The PM provides sufficient spaces within which macromolecular interactions can take place efficiently, including the clustering of proteins in oligomeric complexes and the lateral diffusion of proteins. So far, among the currently identified GPI-anchored proteins in plant cells, SKU5-GFP has been experimentally demonstrated to be associated with the PM and localized to intracellular structures [20], which were found to be well co-localized with FM4–64-stained PM and vesicles (Additional file 2: Figure S6). The motility of membrane proteins is a critical determinant of their interaction capabilities and functions. Utilizing VAEM-based single-particle tracking, we were able to record and analyze the kinetic parameters representing the dynamics of SKU5-GFP puncta at single-particle level, including the fluorescence intensity, retention time, motion range, velocity, trajectory, and diffusion coefficient of individual puncta. As an example, the fluorescence intensity and retention time of individual puncta were analyzed with MATLAB software as examples (Fig. 6).
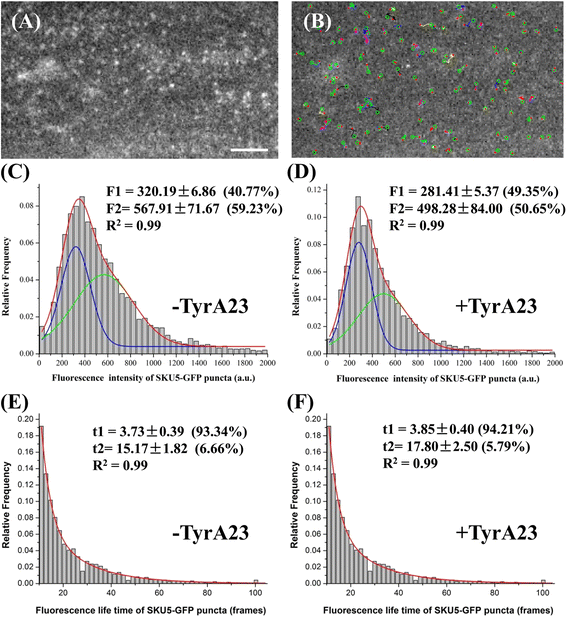
Single particle tracking and computational analysis on puncta of SKU5-GFP captured with VAEM. a A representative frame of time-lapse images for SKU5-GFP tagged puncta; b Trajectory of tracked puncta of SKU5-GFP-tagged puncta in panel (a); c The tracked SKU5-GFP tagged puncta were skewed to two populations in the histogram analysis based on fluorescence intensity after Gaussian fitting, implying different clustering pattern for the two populations; d TyrA23 treatment significantly altered the proportions of the two populations (P < 0.05); e The SKU5-GFP puncta were aligned to two populations in the histogram analysis based on life time after exponential fitting, implying different association states of the two populations; f The lifetime for two populations of SKU5-GFP puncta did not change significantly upon TyrA23 treatment (P > 0.05). Bars = 50 μm; P < 0.05, student t-test was carried out to examine the significance for the differences in the proportions between the two populations of SKU5-GFP puncta after tyrA23 treatment; Interval between frames = 200 ms
Notably, the SKU5-GFP puncta displayed different types of dynamic behavior, in which the fluorescence intensity and the retention time were two major parameters for characterizing the motility and oligomeric status of this GPI-anchored protein (Fig. 6a-b). The cumulative histograms for fluorescence intensity showed a skewed asymmetric distribution (n = 1813). Two-fifths (40.77%) of the particles had intensities ranging from 100 to 500 a.u., approximately the range for diffraction-limited monomeric GFP molecules in control cells (Additional file 2: Figure S7), suggesting that these particles were mostly composed of SKU5-GFP monomer. In contrast, the remaining puncta can be considered to exist as clusters composed of two or more SKU5 molecules since the cumulative histograms can be fitted into another Gaussian peak (59.23%) (Fig. 6c). In addition, the retention time (represented by the number of frames) for these particles, from their appearance to their disappearance on the membrane surface, ranged from 10 to 70 frames (2.3 s to 16.5 s), and the cumulative histograms of the lifetimes could be well fitted by a two-order exponential curve (τ1 = 3.73 ± 0.39, 93.34%; τ2 = 15.17 ± 1.82, 6.66%) (Fig. 6e). Moreover, the fit was not further improved with an increase to three exponential components, further implying that, in terms of their lifetime on the PM, SKU5-GFP molecules were largely present in the form of monomers or were organized into oligomers. To test whether clathrin-mediated endocytosis plays a role in membrane dynamics of SKU5-GFP, given that SKU5-GFP colocalized with FM4–64 in intracellular structures, pSKU5:SKU5-GFP seedlings were treated with 50 μM tyrphostin A23 (tyrA23), an inhibitor of clathrin-dependent endocytosis. It was found that, as a consequence, the proportions of the two subpopulations of pSKU5:SKU5-GFP puncta varied significantly (281.41 ± 5.37, 49.35%; 498.28 ± 84.00, 50.65%) (n = 1760, P < 0.05) compared to the control, while the retention time of SKU5-GFP puncta did not show significant changes (τ1 = 3.85 ± 0.40, 94.21%; τ2 = 17.80 ± 2.50, 5.79%) (n = 1760, P > 0.05) (Fig. 6d and f), further implying that clathrin-mediated internalization was involved in the membrane dynamics of both SKU5-GFP subpopulations. Importantly, TyrA23 significantly decreased the fluorescence intensity of both subpopulations and also the percentage of the subpopulation exhibiting higher fluorescence intensity (Fig. 6c-f). Further fluorescence correlation spectroscopy (FCS) analysis on fluorescence fluctuation also revealed a lower SKU5-GFP density (38.4 ± 4.1 molecules mm− 2; 14.9% decrease with respect to control cells at 44.6 ± 3.4 molecules mm− 2; P < 0.05, t-test) was detected after treatment with TyrA23 (Additional file 2: Figure S8).
More than 25% of the proteome of higher plants is predicted to be membrane-associated proteins, including integral membrane proteins or peripheral membrane proteins according to the difference in their topology [43] (Fig. 7a). Considering this, we further selected SKU5 and COBRA, BOR1 and LTi6a, FLOT1a and StREM1.3, which are, respectively, well-characterized representatives of GPI-anchored proteins in the outer leaflet of the PM, transporters as representatives of integral membrane proteins, and proteins associated with the inner leaflet of the PM through post-translational modifications (such as S-acylation) respectively. As all of these proteins exhibited similar punctate structures varying in fluorescence intensity under VAEM, we then studied their dynamic properties in more detail by SPT and further analyzed the dynamic parameters using MATLAB software.
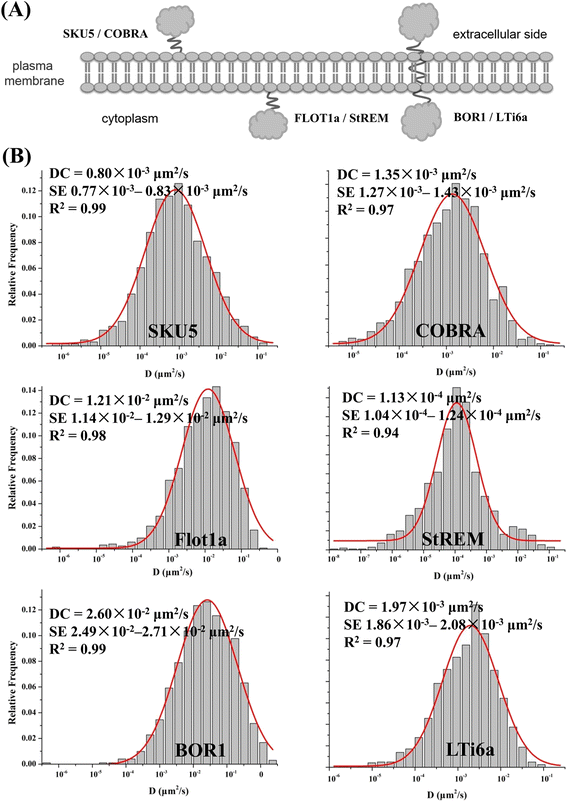
VAEM allows for analysis on dynamics of individual protein candidate at single particle level. Transgenic Arabidopsis line expressing pSKU5:SKU5-GFP, pCOBRA:COBRA-GFP, pBOR1:BOR1-GFP, 35S:LTi6a-GFP, 35S:GFP-Flot1a and 35S:GFP-StREM showing characteristic localization to punctate structures (a), which allows for further analysis on their dynamics on the PM, characterized by diffusion coefficient (DC) (b)
The diffusion coefficient (DC) is obtained from the trajectory of an individual particle, and the statistical distribution of single-trajectory diffusion coefficients may be useful as a measure of the heterogeneity of the membrane (Additional file 2: Figure S9) [28]. Both SKU5 and COBRA are well-characterized GPI-anchored proteins in plant cells, and they are expected to be preferentially located in membrane microdomains [41]. As a result, the diffusion coefficients of SKU5 and COBRA were distributed within one subpopulation of diffusion behavior (DC = 0.80 × 10− 3 μm2/s, n = 1321, SE 0.77 × 10− 3 – 0.83 × 10− 3 μm2/s, r2 = 0.99) (DC =1.35 × 10− 3 μm2/s, n = 1227, SE 1.27 × 10− 3– 1.43 × 10− 3 μm2/s, r2 = 0.97) (Fig. 7b). Similar to SKU5, the DC for LTi6a-GFP puncta was skewed to 1.97 × 10− 3 μm2/s (n = 1228, SE 1.86 × 10− 3– 2.08 × 10− 3 μm2/s, r2 = 0.97), which was comparable to the results obtained for the two GPI-anchored proteins; in contrast, the bona-fide endocytic cargo transmembrane protein BOR1-GFP was also distributed in a punctate manner as observed by VAEM [19]. The DC was 2.60 × 10− 2 μm2/s (n = 1013, SE 2.49 × 10− 2–2.71 × 10− 2 μm2/s, r2 = 0.99) (Fig. 7b), with a large dispersion of diffusion coefficients, most of which were between 2.49 × 10− 2 μm2/s and 2.71 × 10− 2 μm2/s, indicating that the motility of these proteins was heterogeneous, as also shown by kymograph analysis (Additional file 2: Figure S10). The resulting histograms were fitted by one or two Gaussian peaks, identifying as different subpopulations characterized by varying diffusion coefficients. In contrast, the inner-leaflet located AtFLOT1a displayed apparent high motility, and its DC was 1.21 × 10− 2 μm2/s (n = 1137, SE 1.14 × 10− 2– 1.29 × 10− 2 μm2/s, r2 = 0.98), further implying its potential involvement in endocytic events as previously reported. It was notable that the DC for StREM1.3-GFP was the lowest for all of the protein candidates examined, which together spanned a relatively broad range from 10− 8 μm2/s to 10− 2 μm2/s, with 1.13 × 10− 4 μm2/s (n = 1102, SE 1.04 × 10− 4– 1.24 × 10− 4 μm2/s, r2 = 0.94) as the median value; this further implied low motility for StREM1.3-GFP puncta and substantial scaffolding functions in the maintenance of membrane microdomains and in the initiation of signaling processes, as previously reported.